카테고리

How Can a Smart Busway System Improve Rack-Level Power Monitoring in Data Centers?

Data center power distribution has quietly shifted over the past several project cycles. Facilities used to be designed around a simple question: can this feeder deliver enough amperage to the room?
Jul 18th,2026 6 견해

Data center power distribution has quietly shifted over the past several project cycles. Facilities used to be designed around a simple question: can this feeder deliver enough amperage to the room? Today, the question engineers and facility managers actually need answered is narrower and more urgent — how much power is each individual rack actually drawing, right now, and how much headroom does it have before it trips something upstream.

Traditional busway was built to solve the first question. It moves current safely and efficiently from a switchboard to a distribution point, and it does that job well. But a busway that only transmits power without reporting on it leaves facility teams guessing at rack-level reality. They know what capacity was allocated on paper. They don't know what's actually being consumed at cabinet three in row twelve.

At ZHERUTONG, we've spent years working directly with data center engineering teams and OEM clients on busway specification — from new-build hyperscale halls to legacy facilities trying to extend the life of aging switchgear. That vantage point has made one thing clear: rack-level visibility is no longer a nice-to-have feature bolted onto a Smart Busway system. It's becoming the baseline expectation. This article walks through what rack-level monitoring actually means, why it matters for capacity planning and PUE, how the technology delivers that data in practice, and how it fits into retrofit projects involving aging switchgear.

What Does Rack-Level Power Monitoring Actually Mean in a Busway System?

Rack-level power monitoring means measuring current, voltage, and load data at each individual tap-off point feeding a cabinet — not just at the busway's main incoming feed — so every rack's actual power draw is visible in real time.

This distinction matters more than it sounds. Feeder-level monitoring tells you how much total power is entering a row or a section of busway. It's aggregate data — useful for high-level load management, but blind to what's happening cabinet by cabinet. Tap-off level, or rack-level, monitoring isolates the readings for each individual connection point along the busway run, so a facility manager can see exactly which cabinets are running hot on load and which ones are sitting well under their allocated capacity.

The reason this granularity matters so much comes down to capacity planning. When power is only visible at the feeder level, teams tend to allocate capacity conservatively — reserving more headroom per rack than actually gets used, because nobody can prove otherwise. That reserved-but-unused capacity is what the industry calls stranded power, and at scale it can represent a meaningful percentage of total room capacity sitting idle on paper while physically going unused.

Rack-level data also feeds directly into PUE calculations. Power Usage Effectiveness depends on knowing, with some precision, how much energy is actually reaching IT equipment versus how much the facility consumes overall. Feeder-level estimates introduce guesswork into that ratio. Tap-off level readings replace the guesswork with measured numbers.

A simple analogy helps here, especially for procurement teams without a deep electrical background: think of the difference between a building's master utility meter and the individual meters installed at each apartment. The master meter tells the landlord how much total electricity the building used. It says nothing about which unit is running three space heaters. Rack-level monitoring is the apartment meter for data center power.

Which Parameters Should Be Tracked at Each Tap-Off Point?

At minimum, each tap-off point should track current, voltage, power (kW), energy consumption (kWh), and temperature, with power factor and ground fault status added for higher-density racks.

Here's how these parameters typically map to their operational purpose:

Parameter

What It Reveals

Typical Concern Threshold

Current

Actual load draw at the tap-off point

Approaching breaker rating

Voltage

Supply stability at the connection

Deviation beyond ±10% nominal

Power (kW)

Real-time cabinet demand

Compared against allocated capacity

Energy (kWh)

Cumulative consumption for billing/PUE

Trend-based, not threshold-based

Temperature

Contact/connection health at the plug-in point

Rise above ambient +20°C at joint

Power factor

Efficiency of load, harmonic-heavy equipment

Below 0.9 flagged for review

Ground fault

Insulation integrity, safety

Any detected leakage current

Temperature deserves particular attention at tap-off points specifically, as opposed to mid-span busway sections. A loose or degraded plug-in connection generates resistive heating at the contact interface long before it shows up anywhere else in the system. Continuous temperature sensing at these connection points catches developing hotspots before they progress to a failure event — which is a very different posture than relying on periodic thermal imaging scans that only capture a snapshot every few months.

Why Does Rack-Level Granularity Matter for Capacity Planning and PUE?

Rack-level granularity matters because it lets facility teams reclaim stranded capacity, avoid overloading circuits during high-density AI deployments, and calculate PUE with real IT-load data instead of estimates.

Stranded power is one of the more expensive blind spots in data center operations. It happens when the capacity allocated to a rack — based on conservative design assumptions — sits well above what the rack actually consumes. Multiply that gap across hundreds of cabinets and a facility can appear fully allocated on paper while physically having meaningful room to add load. Without rack-level data, nobody can prove that room exists, so it simply goes unused, and expansion decisions default to building or leasing more space rather than reclaiming what's already there.

This problem has become sharper with the rise of high-density AI cabinet deployments. When a facility starts mixing traditional 5-8 kW racks with AI clusters pulling 30 kW or more per cabinet, uniform capacity assumptions stop working. Facility teams need to know, tap-off by tap-off, which circuits have genuine headroom for a high-density deployment and which ones are already near their ceiling. Guessing wrong in either direction is costly — under-provisioning risks nuisance trips, over-provisioning wastes real estate that AI-dense racks desperately need.

PUE calculation is the second major beneficiary. The formula depends on an accurate read of IT equipment power draw relative to total facility power. When that IT-load number comes from panel-level estimates rather than actual cabinet-level measurement, the resulting PUE figure carries built-in error. Rack-level monitoring closes that gap by measuring load at the point closest to the actual IT equipment, which is about as accurate as that number can get without instrumenting the servers themselves.

There's also a load-balancing dimension that's easy to overlook. Three-phase imbalance across a busway run is much easier to spot and correct when you can see load at each individual tap-off point rather than only at the aggregate feeder. Left uncorrected, phase imbalance accelerates insulation aging and can trigger nuisance tripping at the upstream breaker — a failure mode that's frustrating to diagnose without granular data because the aggregate feeder reading can look perfectly normal even while one phase is significantly overloaded relative to the others.

Industry-wide monitoring data backs up the scale of this benefit. Broader adoption of intelligent sensor-based monitoring in busway installations has been associated with fault detection times dropping by roughly 35%, and predictive maintenance approaches enabled by that same data have been linked to service intervention reductions of close to 25%. These are industry-observed patterns rather than universal guarantees, but they line up with what we've seen across the retrofit and new-build projects we've supported.

How Does This Differ From Traditional Panel-Level Metering?

Traditional panel-level metering only shows aggregate load across an entire panel or PDU, while busway-integrated rack-level monitoring isolates data for each cabinet without needing separate meters at every rack.

The practical difference shows up most clearly in deployment cost and long-term maintenance burden. A facility that wants cabinet-level visibility using traditional metering has to install and wire a separate meter at every rack PDU — more hardware, more cabling, more individual maintenance points, and more failure points to troubleshoot over the equipment's service life. A busway system with monitoring built into the tap-off boxes achieves the same granularity through the distribution infrastructure that's already being installed anyway, without the parallel wiring effort.

How Does a Smart Busway System Deliver Rack-Level Data in Practice?

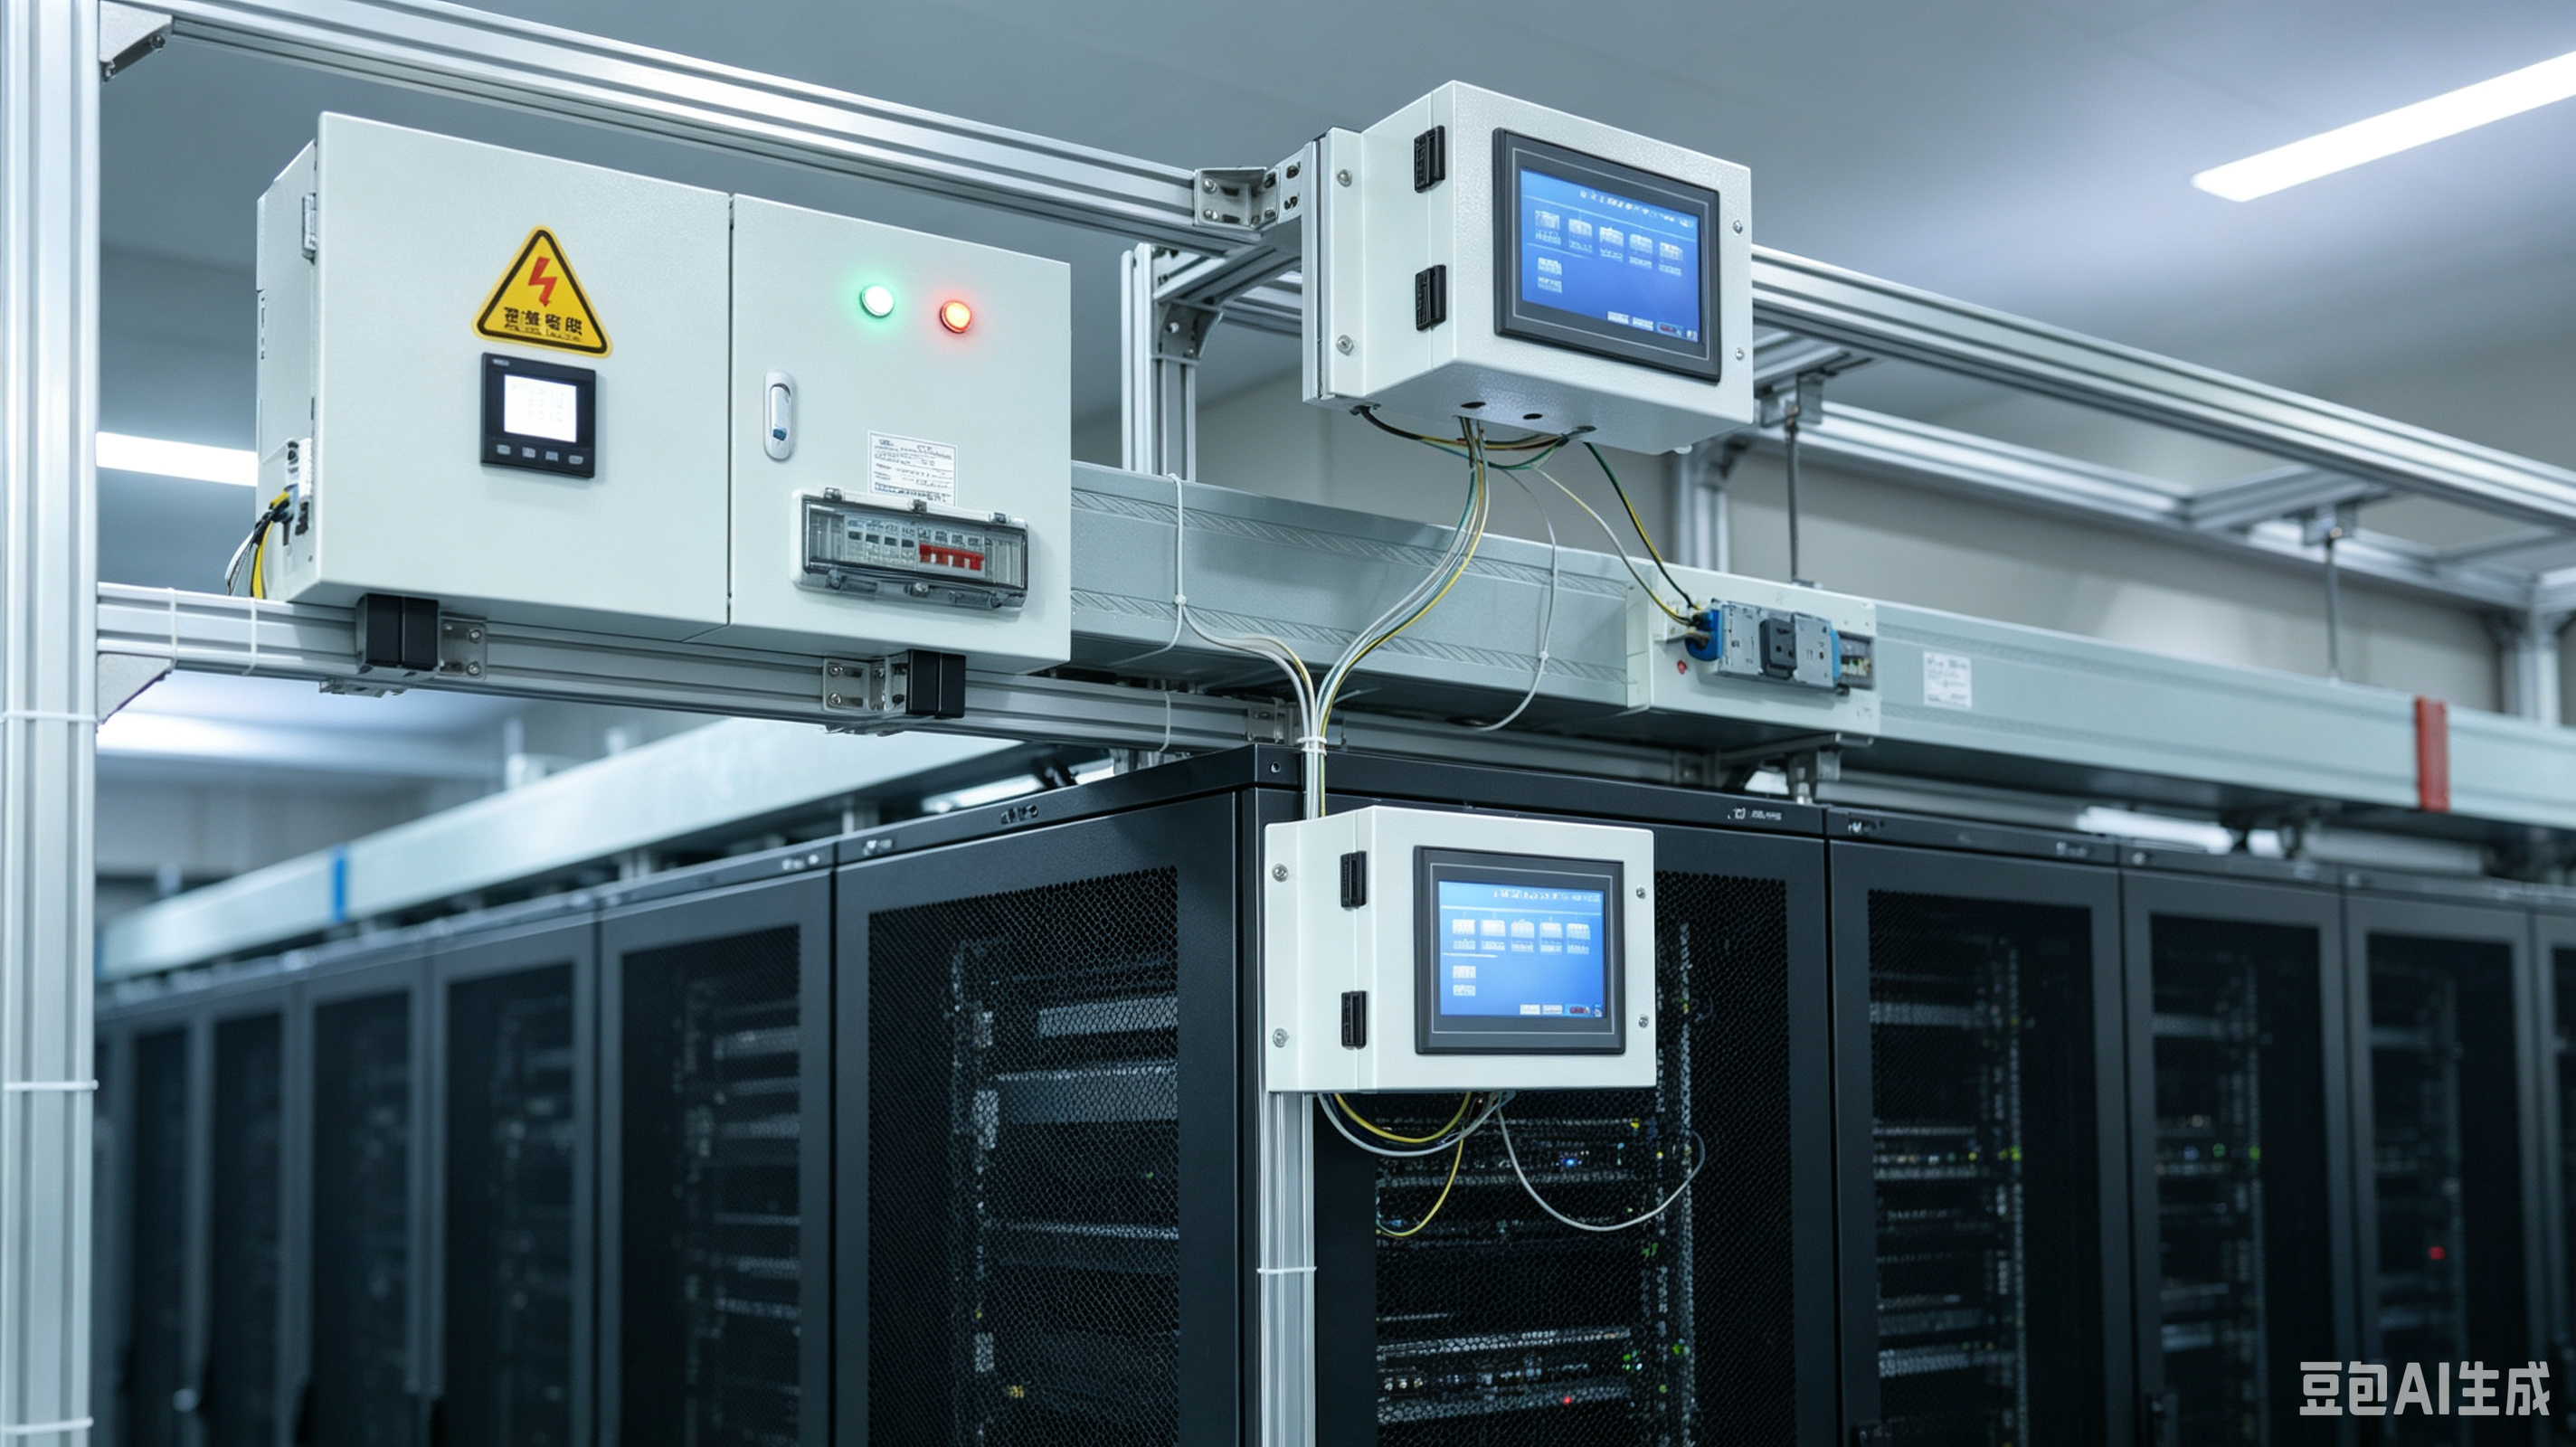
A smart busway delivers rack-level data through sensors embedded at each tap-off box that measure electrical and thermal parameters, transmit readings via a communication bus to a gateway, and display results on local screens or remote monitoring platforms.

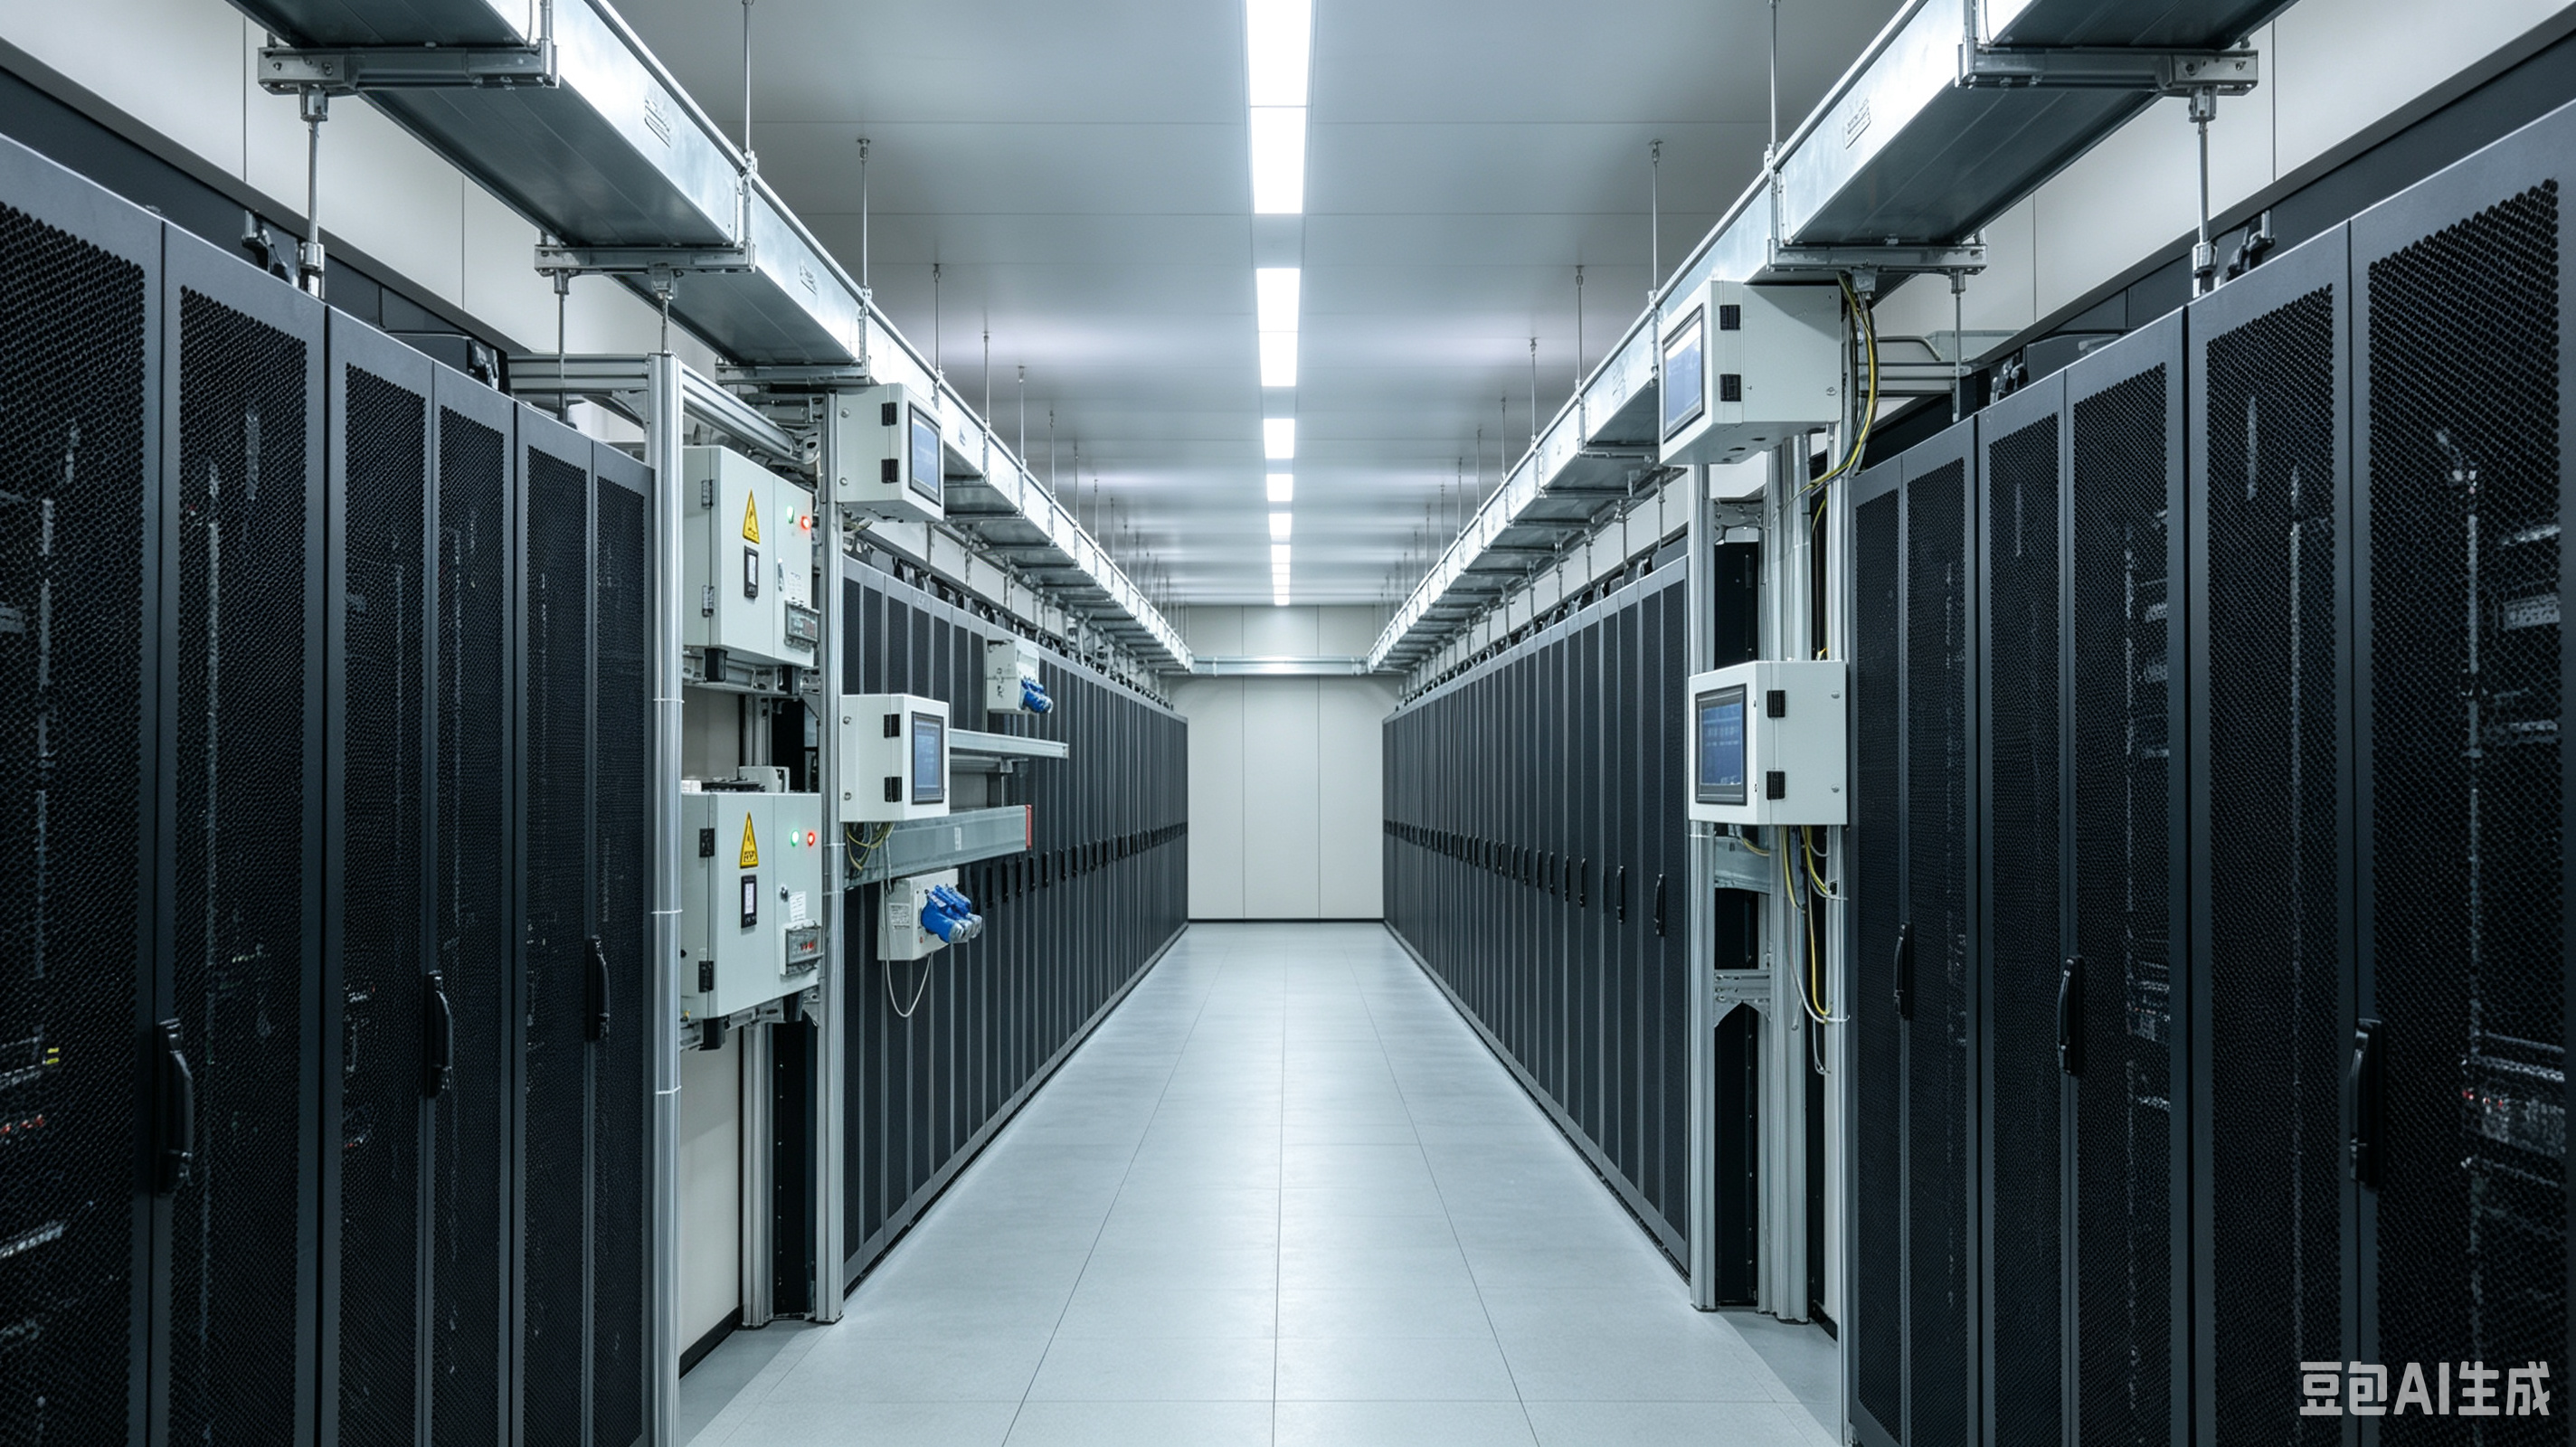
The physical layout typically starts at the tap-off box itself, where current transformers, voltage sensing, and temperature probes sit close to the actual plug-in interface — the point most likely to develop a fault. Sensor modules at the busbar start box and at each plug-in unit capture readings continuously rather than on a scheduled inspection cycle.

From there, readings travel over a communication bus — commonly RS485 with Modbus protocol — to a local touch screen or a gateway device. That gateway aggregates data from every tap-off point along the run and pushes it upstream to whatever monitoring platform the facility uses, whether that's a dedicated DCIM system or a building management platform already in place.

The software layer is where raw numbers turn into something actionable. Rather than requiring an engineer to watch a stream of current and voltage figures, the platform converts that data into threshold-based alerts, historical trend charts, and periodic reports that flag anomalies automatically — a developing hotspot at a specific tap-off, a phase imbalance creeping upward, a load approaching its allocated ceiling.

From a manufacturing standpoint, this is an area where modular design matters more than it might seem. Different projects arrive with different communication requirements — some clients standardize on Modbus RTU across the facility, others need TCP/IP for integration with a specific DCIM package, and some legacy sites still run older protocols that need a gateway translation layer. Building the sensor and communication modules with that variability in mind, rather than forcing a single fixed protocol, is part of how a Smart Busway system stays useful across a genuinely diverse set of deployment environments rather than only fitting a narrow set of new-build specifications.

Can Rack-Level Monitoring Integrate With Existing DCIM Platforms?

Yes, most rack-level busway monitoring systems output standard protocol data (such as Modbus RTU/TCP) that integrates directly into existing DCIM or building management platforms without requiring a separate monitoring silo.

This matters because facility teams rarely want a standalone monitoring dashboard living apart from the systems they already rely on for capacity reporting and alerting. Standard protocol output means the busway's rack-level data can feed straight into the same platform tracking cooling, UPS status, and general facility health. When evaluating a system, it's worth confirming the specific protocol compatibility list upfront during the quoting stage rather than discovering a gap after installation — a five-minute conversation early on that avoids a much more expensive integration problem later.

How Does a Smart Busway Retrofit Fit Into Aging Switchgear Upgrade Projects?

A smart busway retrofit fits into aging switchgear upgrade projects by adding monitoring-capable busway sections and tap-off boxes onto existing distribution paths, giving legacy facilities rack-level visibility without a full switchgear replacement.

Aging switchgear presents a specific dilemma for facility teams. The equipment is old enough to raise reliability concerns, but replacing an entire switchgear lineup outright is disruptive and expensive — often requiring extended shutdown windows that many operations simply can't absorb. A smart busway retrofit for aging switchgear upgrade projects offers a middle path: add monitoring-capable busway sections and tap-off boxes onto the existing distribution path now, gain the visibility and diagnostic benefit immediately, and phase out the older switchgear components on a longer timeline that fits the facility's operational constraints.

We've supported retrofit scenarios where a facility couldn't take a full outage window but still needed to modernize its distribution monitoring. The approach in those cases has generally involved replacing and instrumenting one busway section at a time, coordinating each cutover with a scheduled maintenance window, and keeping the rest of the run live throughout. It's slower than a single wholesale replacement, but it avoids the kind of extended downtime that a full switchgear swap would otherwise require, and it lets the facility start collecting rack-level data on the sections already upgraded while the rest of the plan proceeds.

Compatibility is the recurring theme in these projects. Existing busway runs come in different current ratings and physical joint configurations, and a retrofit needs to match those specifications closely enough that new monitoring-capable sections tie into the old infrastructure without creating a mismatch at the connection point. Physical clearance around aging equipment is often tighter than modern design guidelines would specify, which constrains what tap-off box form factors are even feasible to install.

What Should Engineers Verify Before Specifying a Retrofit?

Before specifying a retrofit, engineers should verify existing ampacity ratings, available physical clearance, busway joint compatibility, and whether the facility's shutdown windows allow phased installation.

A short verification checklist before finalizing a retrofit specification typically includes:

  • Confirming the ampacity rating of the existing busway run against actual and projected load
  • Measuring available physical clearance for new tap-off boxes and sensor modules
  • Checking joint and connector compatibility between legacy busway sections and new monitoring-capable sections
  • Confirming what shutdown windows the facility can realistically offer for a phased cutover

Most of this verification comes down to reviewing existing installation drawings alongside current load data. That review step is usually the natural starting point for a retrofit conversation, and it's worth sending those drawings over early so the actual constraints — rather than assumptions — drive the specification.

Is a Smart Busway System Worth the Investment Over Traditional Monitoring Add-Ons?

A smart busway system is generally worth the investment when a facility needs long-term scalability and centralized visibility, since integrated monitoring avoids the recurring cost of retrofitting separate meters at every rack as density increases.

The comparison here isn't really about upfront cost alone — it's about how the cost curve behaves over the life of the facility. Adding standalone meters rack by rack has a lower initial cost per cabinet, but that cost repeats every time density increases or a new row gets built out. An integrated smart busway system carries a higher upfront investment but scales by simply adding tap-off boxes to an existing run, without new wiring pulls or a separate metering project each time.

Modular expansion is the practical payoff of that structure. When cabinet count grows, or a section of the room shifts to higher-density racks, new tap-off boxes can be added along the existing busway without redesigning the distribution path from scratch. That flexibility is part of why IoT-enabled busway adoption has grown substantially in new commercial and data center projects recently — industry tracking suggests close to 60% of new commercial builds are now incorporating smart monitoring and plug-and-play busway configurations rather than static distribution alone.

That said, the payback logic isn't identical across every project type. A small retrofit adding monitoring to a handful of racks has a different return calculation than a large new-build with hundreds of cabinets planned from day one. The honest answer for most engineers evaluating this trade-off is that it needs to be run against the specific project's drawings and load profile rather than a generic industry rule of thumb.

Where Should You Start When Planning a Rack-Level Monitoring Upgrade?

The best starting point is sharing your rack layout, load profile, and any existing switchgear drawings with a busway engineering team so the monitoring configuration can be matched to your actual capacity and retrofit constraints.

Rack-level monitoring isn't an add-on feature anymore — it's becoming the foundation that capacity planning and PUE optimization are actually built on. Whether the project is a clean new build or a smart busway retrofit for an aging switchgear upgrade, the starting point is the same: get the actual drawings and load data in front of an engineering team before locking in a specification.

As AI-dense cabinet deployments continue pushing per-rack loads higher and facility teams face tighter pressure to prove capacity rather than estimate it, granular power data is shifting from an optional upgrade to a standard design requirement. If you're evaluating a Smart Busway system for a new facility or scoping a retrofit for aging distribution infrastructure, send your rack layout, load profile, and any existing switchgear drawings to rtdq@rtbusway.com, and our team at ZHERUTONG can help match a monitoring configuration to your project's actual constraints — not a generic template.

---

A few common questions that come up in these conversations:

Does rack-level monitoring require rewiring existing racks? Not typically. Because the sensors sit in the tap-off boxes along the busway itself, adding monitoring generally doesn't require new wiring at the rack or PDU level — the busway infrastructure carries both the power and the data path.

How long does a busway retrofit typically take? It depends heavily on facility size and available shutdown windows, but phased retrofits — replacing one section at a time during scheduled maintenance — commonly stretch over several weeks to a few months rather than requiring one continuous outage.

Can rack-level data be exported for capacity reports? Yes. Most platforms support exporting historical and real-time data in standard formats, and since the data typically runs over Modbus or similar protocols, it can also feed directly into existing DCIM reporting tools rather than requiring a separate export step.

What happens if a tap-off sensor fails? A properly designed system isolates sensor faults so a single failed sensor doesn't interrupt power delivery through that tap-off point — it simply flags a data gap for that connection while the electrical supply continues uninterrupted.

Is rack-level monitoring only useful for very large data centers? No. Smaller facilities and edge deployments benefit from the same stranded-capacity and PUE visibility, often with a faster payback given the higher relative cost of overprovisioning in a smaller footprint.

문의하기

궁금한 점이 있으시면 언제든지 문의해 주세요! 주저하지 마시고 연락 주세요. 저희는 고객 만족을 위해 최선을 다하고 있습니다.
이름 *
Company Name *
이메일 *
Country
메시지 *
메시지를 남겨주세요
이름 *
Company Name *
이메일 *
Country
메시지 *